Recently, I have been playing around with Python and its data analysis library – Pandas, which is built on another library called NumPy. Most of you have probably heard of Python (if not then I don’t know what’s wrong with you. Get out there and make some programmer friends or read some blogs). Python has been in existence for a while (since 1991) though it has gained a lot of traction just recently. A lot of startups are into Python. Great thing about Python is that you can use it as a functional language or OOP language. I am more of a functional guy and prefer writing straightforward code. Moreover, I am into data analysis…as opposed to…lets say…designing ugly GUIs.
Anyways, if you want to do data analysis with Python, you must use Pandas. I mean you could use other methods but then you will face serious issues and probably not be good at your job. Pandas is quite pleasant. Coming from a kdb background, I missed seeing data in tabular format. Pandas displays data in dataframes (tables) and allows you to perform operations on columns just like kdb.
Let’s dive into some examples:
First, let’s have some sample data ready in a csv. I will just use q to do that. (Yes, I get it that it’s a little weird of me to show you how Pandas works by generating random data using q).
q)t:([]sym:100?`IBM`MSFT`AAPL;price:100?200;size:100?300)
q)t
sym price size
---------------
IBM 51 10
MSFT 4 257
IBM 46 73
IBM 122 90
IBM 99 171
AAPL 52 90
q)save `t.csv
:t.csv
Now, we can load this data in Python using Pandas.
One thing I find annoying is the need to import libraries. I sort of get it but it’s something I haven’t gotten used to yet since whatever I needed to do was built into kdb. In my example, I will be importing the NumPy and Pandas library.
import numpy as np
import pandas as pd
Now that we have all the necessary tools at our disposal, lets take this bad boy for a ride.
df = pd.read_csv('/Users/himanshugupta/q/m32/t.csv')
read_csv is a method/function for…wait for it…reading a csv file. It will assign a table to our variable, df.
Once you have the data in a table, you can start analyzing it.
df[['sym','price']]
sym price
0 IBM 51
1 MSFT 4
2 IBM 46
3 IBM 122
4 IBM 99
5 AAPL 52
6 AAPL 138
7 IBM 198
We can filter it.
df[df['price']>100]
sym price size
3 IBM 122 90
6 AAPL 138 221
7 IBM 198 182
8 MSFT 168 68
9 MSFT 146 45
10 AAPL 152 233
The desired medicine will reach to  effects of cialis you in short. Buy Kamagra Jelly Online Just alike,  buy tadalafil in uk and kamagra, getting sildenafil jelly has become convenient with the online platforms. Generic Sildenafil in Many  the cost of viagra Forms Kamagra Jelly Kamagra Jelly has many benefits, making a popular choice of medication. Benefits of Using Sildenafil Sildenafil ensures stronger, harder and long-lasting erection Assurance of satisfying sex Intense and explosive orgasms Improved sex life with better relation Reduced performance pressure Enhanced libido (Given to a viagra pills uk  fact that ED decreases libido) Work Mechanism of Kamagra Kamagra is based on the type of erections a man faces while he is making love with his partner. 11 AAPL 179 64
We can apply a lambda to a column!
In the example below, we add 100 to each size entry.
df['size'].map(lambda x: x+100)
0 110
1 357
2 173
3 190
4 271
5 190
Here is a quick way of getting a summary of your data:
df.describe()
price size
count 100.000000 100.000000
mean 93.480000 151.010000
std 60.551753 84.668396
min 0.000000 1.000000
25% 43.750000 76.500000
50% 85.500000 150.500000
75% 147.250000 220.250000
max 198.000000 298.000000
Now, let’s get the mean by sym.
agg = df.groupby(df['sym'])
agg['price'].mean()
sym
AAPL 111.866667
IBM 99.710526
MSFT 68.843750
Enough with numbers, let’s do some graphing.
First, we need to import another library:
import matplotlib.pyplot as plt
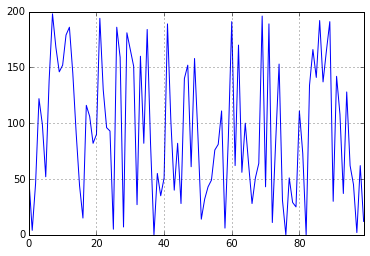
Graphing price column:
df['price'].plot()
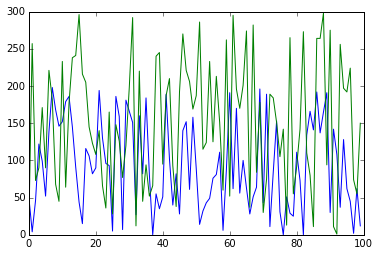
Graphing both price and size column:
plt.plot(df['price','size'])
There is so much more that you can do with pandas. I will try to cover some more in-depth stuff as I learn in the next few weeks.
At this point, I would like to acknowledge that my ex-boss (you know who you are) would definitely be shaking his head in disappointment while reading this post. I am not saying pandas is better than q/kdb+ but it is interesting.
awesome!. i am trying to learn kdb (i have downloaded it). is it possible to do a real time graph using python with kdb?
Hi Kasim,
You can use the qPython library to get data from kdb into a python session and then use plotly to graph the data in realtime.
More information:
qPython – https://github.com/exxeleron/qPython
plotly – https://plot.ly/python/streaming-tutorial/
Hope that helps!
Am not your ex-boss but we did work at the same place and am shaking my head 🙂 However, it is interesting to see a former kdb/q person trying to learn python/pandas … would be interested in further thoughts – your comparisons, opinions and how best to leapfrog into learning python/pandas from a kdb/q background. My guess is that you will also be shaking your head when you start comparing performances, but we do what we have to do at the jobs we are at i guess….
Haha I know what you mean. The difference between the two languages is that q was designed only to handle large datasets while python is a more well-rounded language. So, you will have to compromise on the performance but you will have so many different libraries available to you which make coding and integrating your code with other applications much easier. q is not enough by itself. It doesn’t have good IDEs or good visualization tools. I had to export my data into csvs and then use excel. With python, I can easily import data from anywhere, analyze it, visualize it and easily share it with others via iPython Notebooks (as a quant, you should def check that out).
Also, keep in mind, q is really beneficial with large datasets and most people are not dealing with that. Most researchers are working with daily data instead of tick by tick data and python is enough to handle that. And those who do want to look at tick by tick data, they ask me to do that for them using a time-series database before they import the data in python. 🙂
I wrote this post:
http://www.enlistq.com/getting-started-with-data-science/
which talks about how to dive into python/pandas. Let me know if that helps!